Research

Target Volume Delineation Variability and the Effect of Contouring Training during Stereotactic Body Radiation Therapy (SBRT) Planning for Lung Cancer
1*,Matthew D. Orton MD, 2,3Michael G. Chang MD, 2,3Drew Moghanaki MD, 2Keith Neiderer CMD, 2Alfredo Urdaneta MD, 2Jessica Schuster MD, 2Elisabeth Weiss, MD
- 1 Indiana University Health Arnett, 22Virginia Commonwealth University and 3Hunter Holmes McGuire VA Medical Center, Richmond, VA, United States
- Submitted Friday, March 07, 2014
- Accepted: Friday, June 06, 2014
- Published Wednesday, June 11, 2014
This is an Open Access article distributed under the terms of the Creative Commons Attribution License (http://creativecommons.org/licenses/by/3.0), which permits unrestricted use, distribution, and reproduction in any medium, provided the original work is properly cited
Abstract
Introduction: To investigate the variability of target volume delineation, analyze its dosimetrical importance, and evaluate the effect of contouring training during treatment planning for early stage lung cancers treated with SBRT.
Study Design
Retrospective
Methods
Nine radiation oncologists independently delineated lung tumor volumes in 6 patients after 4D-CT simulation. Tumor delineation occurred in 3 sessions: prior to contouring training, after completing training, and >2 weeks after the second session to assess intraobserver variability. Target volumes were evaluated for variations in the magnitude of volumes (coefficient of variation (COV) = standard deviation/mean volume), volume overlap (conformality index (CI) = common volume/encompassing volume), and 3D vector displacements. To evaluate the dosimetrical effect of target volume variability, treatment plans were created for all 54 planning target volumes of session 2 and compared to the reference treatment plan.
Results
From sessions 1 to 3 the mean interobserver 3D vector displacements (0.8 to 0.5 mm, p=0.01), COV (0.25 to 0.19, p=0.03), and CI (0.35 to 0.44, p=0.03) demonstrate significant improvements. Intraobserver variability in 3D vector displacements and CI demonstrated statistically non-significant improvements from session 1 to 3. Planning target volume underdosage by 3% or more compared to the reference plan was found in 23% of all session 2 contours.
Conclusions
Intra- was smaller than interobserver variability; both could be improved with repeat contouring and contouring training. Planning target volume variability demonstrated underdosing most commonly in lesions located centrally, showing spiculations, or with pleural attachments suggesting a need for a standardized approach to delineate such lesions
Introduction
Stereotactic body radiotherapy (SBRT) for medically inoperable patients with early stage lung cancer offers excellent local control rates by delivering large doses per fraction with a high degree of geometrical precision [1]. While the effect of geometrical precision and technical factors on overall treatment accuracy and tumor control are currently being investigated, limited information is available regarding target definition.
Uncertainty in target volume delineation has been studied in locally advanced lung cancer (T1-3N0-3) with no specific focus on lung SBRT [2]. Since typical planning target volume (PTV) margins for stereotactic cases are only 5 mm for respiration-managed treatments, slight variations in the delineated tumor volume could potentially have a significant impact on tumor control [3]. While the true extent of the tumor is uncertain, several radiographic presentations, such as large pleural attachments, the presence of spiculae, feeding vessels, and ground glass appearance pose major challenges in tumor delineation. The instructions for target delineation found in current SBRT protocols (e.g. Radiation Therapy Oncology Group (RTOG) 0618 and 0813) do not provide specific instructions on managing ambiguous tumor extents. Moreover, the effect of contouring training on target volume variability, especially for lung SBRT, has not been extensively evaluated [4,5]
The purpose of the present study is to evaluate inter- and intraobserver variability in the target volume delineation of early stage lung cancer with a range of radiographic appearances. In addition, the effect of dedicated contouring training and dosimetric consequences of delineation variability were analyzed.
Materials and Methods
Patients
Six patients treated with SBRT for T1N0M0 non-small cell lung cancer (AJCC 7th ed.) were selected to represent a range of radiographic scenarios (Table 1). All patients were treated free-breathing using internal target volume (ITV)-based treatment planning following 4D- computed tomography (CT) simulation and daily cone-beam CT for patient set up.
|
Patient
|
Lesion
|
Location
|
Volume ± SD (cm3)
|
|
1
|
|
Right lower lobe T1 lesion abutting the chest wall with pleural
attachments
|
13.8 ± 2.5
|
|
2
|
|
Right middle lobe centrally located T1 lesion
|
11.1 ± 3.4
|
|
3
|
|
Right upper lobe T1 lesion with pleural tails and feeding vessel
|
4.0 ± 1.0
|
|
4
|
|
Right middle lobe T1 lesion with feeding vessels and spiculae
|
4.3 ± 1.0
|
|
5
|
|
Right lower lobe spiculated T1 lesion
|
1.7 ± 0.5
|
|
6
|
|
Right lower lobe T1 ground glass lesion
|
4.2 ± 0.9
|
Image acquisition for treatment planning
A Philips 16-slice Big Bore Brilliance CT scanner (Philips Medical Systems, Cleveland, USA) and the Real-Time Position Management System (RPM, Varian Medical Systems, Palo Alto, USA) were used to obtain non contrast 4D-CT scans for treatment planning (120 kV, 50 mA, slice thickness 3 mm, pitch <0.1). Ten phase-sorted image bins (0% - 90%) were generated to retrospectively create 10 3D-CT scans that reflect the different anatomy positions in the sinusoidal breathing pattern with 0% representing end-inspiration, 50% end-expiration, and 90% close to end inspiration. Both a maximum intensity projection (MIP, using all 10 breathing phases 0-90%) and an average (AVE, defined as the 30% respiratory phase) dataset were reconstructed.
Contouring
Andover, USA). PET (positron emission tomography)/CT fusion to the MIP projection was performed first with rigid bony anatomy-based registration, then with manual alignment of the tumor. As the treated lung cancers are small and are typically found in patients with underlying lung disease which is accompanied by irregular structural lung changes, PET/CT images were available to the observers to aid in localizing the tumor. Due to the inherently limited spatial and temporal resolution, PET/CTs were not used for delineation. Nine physicians (3 attendings with clinical lung SBRT experience and 6 residents who had completed a lung SBRT rotation) independently contoured the lung tumor internal target volume (ITV) on the MIP datasets of the 6 selected patients. In order to determine observer variability and the effect of the training module, contouring was performed at 3 separate time points. Session 1 occurred prior to training based on the instructions found in RTOG trials 0618/0813. Following session 1, each observer was provided an electronic in house PowerPoint training module containing specific instructions on how to delineate lesions with pleural attachments, spiculae, and ground glass changes for review, no formal class or combined training sessions were held. Session 2 was performed after completing the training module, typically within a one-week time window. Session 3 occurred>2 weeks after the second session to assess intraobserver variability. Observers were encouraged to review the PowerPoint training prior to session 3. Default lung and mediastinal windows were used for delineation. Zoom factors could be manipulated by each physician. Observers were blinded to their own prior contours and contours of other observers.
Data analysis
Mean volumes and mean 3D vector lengths of individual observer centroids from the average centroid locations were calculated for each patient, session, and observer. Variability in the magnitude of volumes was assessed by determining the percent difference between mean volumes utilizing the coefficient of variation (COV) defined as COV = SD/mean volume [6,11]. The smaller the COV, the better the agreement in the magnitude of volumes. Variability in volume overlap was quantified using the conformality index (CI), defined as the ratio of the common volume identified by all observers and the largest encompassing volume of all observers [10]. A CI of 1 indicates perfect agreement or overlap of all contours while a value of 0 represents no overlap. Inter-observer variability in the magnitude of volumes, vector lengths and volume overlaps were evaluated for all three sessions and for all observers using the above mentioned parameters. The effects of training and repeated contouring on interobserver variability were evaluated by comparing the variability between the three sessions. Intraobserver variability was evaluated by comparing variability between session two and three. Observers were subdivided into attending and resident physician observers to evaluate the effect of clinical experience on variability. The indices of variation were compared using a two-tailed Student T-test with p-values of <0.05 considered statistically significant.
For dosimetric evaluation, a 5 mm uniform expansion was created on each observer’s ITV to create a PTV volume equivalent to standard recommendations in current SBRT clinical trials. Optimized treatment plans were created by a single dosimetrist for all 54 PTVs generated in session 2. The minimum dose to 100% of the PTVs (D100) of all plans was ≥ 99% of the prescription dose. The volume of each PTV covered by 95% or more of the prescribed dose (V95) was 100%. To identify potential underdosage through contouring variability, coverage of each observer’s PTV by the plan used for patient treatment (reference plan) was analyzed for all 6 patients, V95 coverage of each observer’s PTV by the reference plan was determined and reductions in the V95 by 3 % or more compared to the reference plan were recorded.
Results
Interobserver variability
Interobserver volume variation indices for each patient are listed in (Table 2), while averages for each session are shown in table 3. Average 3D vector differences from the mean centroid decreased significantly between sessions 1 to 3 for attending (0.7 to 0.5 mm), residents (0.8 to 0.6 mm) and the group as a whole (0.8 to 0.5 mm). The average COV demonstrated less variability from sessions 1 to 3 (0.25 to 0.19, p=0.03) while the CI demonstrated better agreement from sessions 1 to 3 (0.35 to 0.44, p=0.03). Minimal variation was noticed between session 1 and 2 while a large improvement in contouring conformality was found for all indices between sessions 2 and 3. Variations were largest in tumors located centrally, with pleural attachments, and spiculations ((see Table1 )
|
|
Session
1
|
Session
2
|
Session
3
|
|
Patient
|
Mean
Volume
± SD (cm3)
|
COV
|
CI
|
Mean
Volume
± SD (cm3)
|
COV
|
CI
|
Mean
Volume
± SD (cm3)
|
COV
|
CI
|
|
Patient 1
|
13.8 ± 2.6
|
0.18
|
0.46
|
14.7 ± 2.8
|
0.19
|
0.39
|
15.1 ± 2.6
|
0.17
|
0.46
|
|
Patient 2
|
11.1 ± 3.4
|
0.31
|
0.28
|
11.9 ± 3.1
|
0.26
|
0.36
|
12.4 ± 2.0
|
0.16
|
0.48
|
|
Patient 3
|
4.0 ± 1.0
|
0.26
|
0.39
|
4.2 ± 1.0
|
0.23
|
0.41
|
4.7 ± 1.1
|
0.23
|
0.42
|
|
Patient 4
|
4.3 ± 1.0
|
0.23
|
0.39
|
4.5 ± 1.3
|
0.28
|
0.36
|
4.7 ± 0.8
|
0.17
|
0.50
|
|
Patient 5
|
1.7 ± 0.6
|
0.32
|
0.32
|
2.0 ± 0.6
|
0.28
|
0.31
|
1.9 ± 0.5
|
0.24
|
0.39
|
|
Patient 6
|
4.2 ± 0.9
|
0.22
|
0.28
|
4.6 ± 0.8
|
0.18
|
0.34
|
4.4 ± 0.8
|
0.19
|
0.42
|
Indices of variation for each session by patient. Conformality index (CI), Coefficient of variation (COV), Standard deviation (SD).
Attending versus resident interobserver variability
A summary of attending versus resident interobserver variability is shown in (Table 3) While in general 3D vector differences, COV and CI indices showed improvement with repeated contouring and contouring training, the largest improvements were seen for resident physicians. Attendings showed better agreement in session 1 leaving less room for improvement compared to residents. The differences in resident vs. attending 3D vector displacements were not significant (p>0.2) for any session. COV differences were significant for session 1 (0.69 vs. 0.37, p<0.001), but by session 2 and 3 resident COVs were comparable to attending COVs. Differences in CI were found to be significant between residents and attendings for all 3 sessions but do demonstrate improvement in conformality with each session.
|
Session
|
Average Volume
± SD (cm3)
|
Average 3D Vector
from Mean
Centroid (mm)
|
Average COV
|
Average CI
|
|
Session 1
|
6.5 ± 1.6
|
0.8&
|
0.25*
|
0.35†
|
|
Attending
|
7.0 ± 0.6
|
0.7
|
0.09
|
0.69
|
|
Resident
|
6.3 ± 1.9
|
0.8&
|
0.31
|
0.37
|
|
Session 2
|
7.0 ±
1.6
|
0.9!
|
0.24
|
0.36‡
|
|
Attending
|
6.9 ±
1.4
|
0.7!
|
0.19
|
0.61
|
|
Resident
|
7.0 ±
1.8
|
1.0!
|
0.26
|
0.40
|
|
Session 3
|
7.2 ± 1.3
|
0.5!&
|
0.19*
|
0.44†‡
|
|
Attending
|
6.9 ±
1.2
|
0.5!
|
0.19
|
0.63
|
|
Resident
|
7.4 ±
1.4
|
0.6!&
|
0.20
|
0.50
|
SD: Standard deviation; COV: Coefficient of variation; CI: Conformality index.Significant findings: *COV Session 1 vs. Session 3 (p=0.03). †CI Session 1 vs. Session 3 (p=0.03). ‡CI Session 2 vs. Session 3 (p=0.01). !Average Vector Session 2 vs. Session 3 (p<0.05 for all). &Average vector Session 1 vs. Session 3 (p<0.05 for both)
Intraobserver variability
A summary of intraobserver variation is shown in (Table 4) A trend towards better agreement on the magnitude of volumes with training and repeat contouring was observed which was greater for residents than attendings.
|
Intra-Observer Changes
|
Session 2 vs. 3
|
|
Average Change in Volume ± SD (cm3)
|
11% ± 8%
|
|
Attending
|
9% ± 2%
|
|
Resident
|
13% ± 10%
|
|
Average Intra-observer CI ± SD
|
0.81 ± 0.06
|
|
Attending
|
0.84 ± 0.06
|
|
Resident
|
0.79 ± 0.06
|
|
Average Vector From Mean
Centroid
± SD (mm)
|
0.3 ± 0.2
|
|
Attending
|
0.2 ± 0.1
|
|
Resident
|
0.3 ± 0.3
|
SD: Standard deviation; CI: Conformality index.
Dosimetric analysis
A summary of the dosimetric impact on PTV coverage is shown in (Table 5) . Results demonstrated excellent PTV V95 coverage of individual PTVs by the reference plan. The percentage of PTVs where V95 was underdosed by ≥3% compared to the reference plan was 23%, occurring most frequently in lesions with pleural attachments (patient 1) and central location (patient 2).
(,Fig 1,]
|
|
Mean PTV (cm3)
|
PTV Mean V95% ± SD
|
# Cases PTV V95% >3%
Underdosed
|
|
Case 1
|
44.1
|
93.8% ± 8.7%
|
4/8 (50%)
|
|
Case 2
|
36.4
|
96.5% ± 5.4%
|
3/8 (37.5%)
|
|
Case 3
|
17.4
|
99.5% ± 1.1%
|
1/8 (12.5%)
|
|
Case 4
|
18.6
|
98.3% ± 4.4%
|
1/8 (12.5%)
|
|
Case 5
|
11.4
|
99.8% ± 0.3%
|
0/8 (0%)
|
|
Case 6
|
18.6
|
98.5% ± 2.7%
|
2/8 (25%)
|
|
Overall Average
|
24.4
|
97.7% ± 3.8%
|
1.8/8 (22.9%)
|
Planning target volume (PTV), Standard deviation (SD), Planning target volume receiving 95% of prescribed dose (V95%)
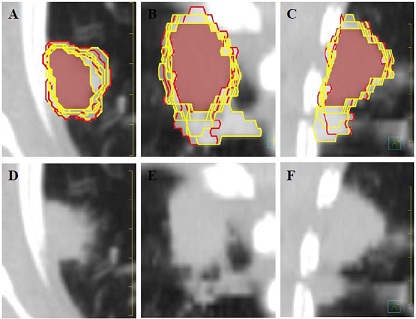
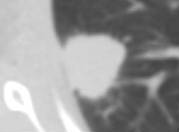
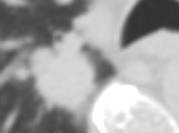
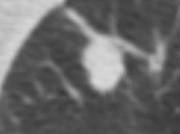
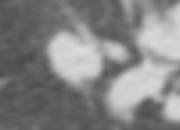
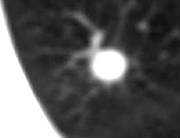
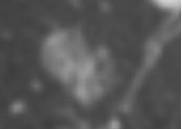
Figure 1: Interobserver ITV variability for Session 2 Patient 1. A-C: Axial, coronal and sagittal images with internal target volume (ITV) contours; (yellow) resident ITVs, (red) attending ITVs, (white fill) encompassing volume, (maroon fill) common volume. D-F: Axial, coronal and sagittal images without contours.
Discussion
A small number of published studies have evaluated contour variability for patients treated solely with SBRT for small lung tumors [9,12]. Altorjai et al. [9] evaluated interobserver variability in lung tumor contours comparing cone-beam CT vs. 4D CT for SBRT. Van Dam et al. [12] reported interobserver variability when evaluating the optimal approach to identifying ITV volumes in T1a-T3NO lung cancers, while the current study utilized 4D CT simulation and ITV based SBRT planning to evaluate variabilities in contouring, effect of contour variability on dosimetrical analysis, the effect of a PowerPoint training module, and the influence of physician experience.
Interobserver Variability
Interobserver variability was found to be smaller among attending physicians compared to resident physicians, suggesting variability can be decreased by clinical experience. Additional training and repeated contouring demonstrated that reduction in contour variability was most pronounced among resident observers. 3D vector differences from mean centroids demonstrated excellent agreement for each tumor with average differences <1 mm. The range of COV in the present study (0.04 to 0.39) is comparable to COV results obtained by Altorjai et al. [9] (0.09 to 0.29) with free breathing CTs. Average interobserver CI in the present study was 0.38, similar to 0.37 published by Altorjai et al.[9]. The clinical consequences of physician contour variability remain unknown, but could potentially lead to larger sources of error than setup errors of treatment for a technique which often has only a 5 mm ITV to PTV expansion.
Intraobserver Variability
Intraobserver variability was smaller than interobserver variability in this study and was similar to Altorjai et al. [9]. Differences were consistently smaller among attending physicians than resident physicians although some residents demonstrated variability equal to attending levels. Overall, intraobserver inconsistencies were small and likely result from variations in time pressure, concentration, attention and contouring fatigue to which all observers are susceptible as well as the individual observer’s clinical experience.
Dosimetric analysis
Our study demonstrated that overall excellent PTV coverage could be obtained with the reference plan. However, when treating centrally located lesions, lesions with pleural attachments, spiculae and ground glass changes, contour variability could result in >3% of PTV undercoverage, when compared with the reference plan. The reference plan used for comparison was the contour of the treating physician. Other ways have been and could be used to define a reference plan, but in the clinic only one contour is used and was used in the treatment of the patients. Potentially, this may lead to clinically relevant differences in tumor local control. The lesions with the greatest likelihood of underdosage (see Table 5) could benefit from a standardized contouring approach to delineating such lesions. Depending on the estimated risk for side effects, we recommend erring on the more generous side and including all areas of potential tumor extent.
Training
Little information is available regarding the effects of contour training on contour variability. Dewas et al. [5] demonstrated a trend toward decreased contour variability in a single advanced stage lung cancer patient contoured by 32 resident physicians before and after a formal training session. Bowden et al. [4] demonstrated a reduced average interobserver variation in absolute tumor volumes by 7% (20% to 13%) using a contouring protocol. Our results demonstrate improvement in all parameters of variation from session 1 to 3. While both groups benefit from training the improvement is larger for resident observers than for attending observers. Training effectively reduced contouring disparity between attending and resident physicians. Although improvement with training was noticed, the impact of training was not very high, probably due to the good agreement present at the initial contouring session and possibly because the lesions were small and, in comparison to many tumor volumes contoured by radiation oncologists, are better defined. Additionally, all observers in this study were from a single institution and work closely together resulting in good agreement without extra training. More formal training sessions with a presentation in a lecture format with time for questions could potentially improve training, but would not mirror current contour training provided for most radiation oncologists.
The development of a standardized training guideline is challenging because radiographic findings are not well correlated with true tumor extent [13,17]. Stroom et al. [16] demonstrated that most tumor volumes identified on CT scans are on average 4 cm3 too large. However, for a patient with pleural attachments, the CT identified contours were 16 cm3 to small. Chan et al. [13] and Kuriyama et al. [15] reported that pleural attachments often consist of inflammatory tissue, but these areas can harbor tumor cells. Both of these studies are small and cannot be generalized to all patients making an evidence-based contour guideline problematic. Challenges with delineating tumors have been well documented in the literature. Utilization of modern imaging techniques such as FDG-PET CT and adding IV contrast to CT simulation for a more accurate tumor delineation are active areas of research [8,18,14,19].
Conclusion
This study showed that contouring variations overall were small, particularly for attending physicians, and could be reduced with training and repeated contouring. The dosimetrical impact of contouring variability appeared to be small overall. The largest contouring and dosimetrical variations were found in tumors located centrally, showing spiculations, or associated with pleural attachment, suggesting these features pose contouring challenges. Further development of uniform standards for tumor delineation is needed to ensure adequate tumor coverage and improve consistency.
Conflict of Interest Statement and Disclosures
This work has been partially supported by NIH grant P01CA116602. Dr. Weiss has research agreements with Varian and Philips Medical Systems. None of the authors has a conflict of interest.
Authors' Contribution
MDO – Involved in the conception, design, analysis,
acquisition of data, interpretation of data, drafting and editing of the article
MGC – Involved in design and acquisition of data and editing of the article.
DM - Involved in design and acquisition of data and editing of the article.
KN – Involved in the analysis, interpretation of data, and editing of the
article.
NOR – Involved in design and acquisition of data.
RBV – Involved
in design and acquisition of data.
MN – Involved in design and acquisition of
data and editing of the article.
AU– Involved in design and acquisition of
data.
JS – Involved in design and acquisition of data.
EW – Involved in
the conception, design, analysis, acquisition of data, interpretation of data,
drafting and editing of the article
Ethical Considerations
This research was approved by the VCU institutional IRB and
adheres to all ethical standards. This is an original manuscript and all authors
were instrumental in its creation. The conflicts of interest are as follows:
this work was partially supported by NIH grant P01CA116602, and Dr. Elisabeth
Weiss has a Varian Research grant.
Funding
Partially supported by NIH grant P01CA116602
Acknowledgement
None declared
References
[1].Timmerman R, Paulus R, Galvin J, et al. Stereotactic body radiation therapy for inoperable early stage lung cancer. JAMA 2010; 303 (11):1070-1076. doi:10.1001/jama.2010.261[pubmed]
[2].Vorwerk H, Beckmann G, Bremer M, et al. The delineation of target volumes for radiotherapy of lung cancer patients. Radiother Oncol 2009; 91(3):455-460[pubmed]
[3].Shah C, Grills IS, Kestin LL, et al. Intrafraction variation of mean tumor position during image-guided hypofractionated stereotactic body radiotherapy for lung cancer. Int J Radiat Oncol Biol Phys 2012; 82 (5):1636-1641[pubmed]
[4].Bowden P, Fisher R, Mac Manus M, et al. Measurement of lung tumor volumes using three-dimensional computer planning software. Int J Radiat Oncol Biol Phys 2002; 53 (3):566-573
[5].Dewas S, Bibault JE, Blanchard P, et al.Delineation in thoracic oncology: a prospective study of the effect of training on contour variability and dosimetric consequences. Radiat Oncol 2011; 6:118[[pubmed]
[6].Giraud P, Elles S, Helfre S, et al. Conformal radiotherapy for lung cancer: different delineation of the gross tumor volume (GTV) by radiologists and radiation oncologists. Radiother Oncol 2002;62 (1):27-36
[7].Steenbakkers RJ, Duppen JC, Fitton I, et al. Reduction of observer variation using matched CT-PET for lung cancer delineation: a three-dimensional analysis. Int J Radiat Oncol Biol Phys 2006; 64 (2):435-448[pubmed]
[8].van Baardwijk A, Bosmans G, Boersma L, et al. PET-CT-based auto-contouring in non-small-cell lung cancer correlates with pathology and reduces interobserver variability in the delineation of the primary tumor and involved nodal volumes. Int J Radiat Oncol Biol Phys 2007; 68 (3):771-778[pubmed]
[9].Altorjai G, Fotina I, Lutgendorf-Caucig C, et al. Cone-beam CT-based delineation of stereotactic lung targets: the influence of image modality and target size on interobserver variability. Int J Radiat Oncol Biol Phys 2012; 82 (2):27[pubmed]
[10].Fotina I, Lutgendorf-Caucig C, Stock M, et al. Critical discussion of evaluation parameters for inter-observer variability in target definition for radiation therapy. Strahlenther Onkol 2012; 188 (2):160-167. doi:10.1007/s00066-011-0027-6
[11].Louie AV, Rodrigues G, Olsthoorn J, et al. Inter-observer and intra-observer reliability for lung cancer target volume delineation in the 4D-CT era. Radiother Oncol 2010; 95 (2):166171.doi:10.1016/j.radonc.2009.12.028[pubmed]
[12].van Dam IE, van Sornsen de Koste JR, Hanna GG, et al. Improving target delineation on 4-dimensional CT scans in stage I NSCLC using a deformable registration tool. Radiother Oncol2010;96(1):6772.doi:10.1016/j.radonc.2010.05.003[pubmed]
[13].Chan R, He Y, Haque A, et al. Computed tomographic-pathologic correlation of gross tumor volume and clinical target volume in non-small cell lung cancer: a pilot experience. Arch Pathol Lab Med 2001;125 (11):14691472.doi:10.1043/00039985(2001)125<1469:ctpcog>2.0.co;2[pubmed]
[14].Dahele M, Hwang D, Peressotti C, et al. Developing a methodology for three-dimensional correlation of PET-CT images and whole-mount histopathology in non-small-cell lung cancer. Curr Oncol 2008;15 (5):62-69 [pubmed]
[15].Kuriyama K, Tateishi R, Doi O, et al. CT-pathologic correlation in small peripheral lung cancers. AJR Am J Roentgenol 1987;149 (6):1139-1143[pubmed]
[16].Stroom J, Blaauwgeers H, van Baardwijk A, et al. Feasibility of pathology-correlated lung imaging for accurate target definition of lung tumors. Int J Radiat Oncol Biol Phys 2007; 69 (1):267275.doi:10.1016/j.ijrobp.2007.04.065 [pubmed]
[17].van Baardwijk A, Bosmans G, van Suylen RJ, et al. Correlation of intra-tumour heterogeneity on 18F-FDG PET with pathologic features in non-small cell lung cancer: a feasibility study. Radiother Oncol 2008; 87 (1):55-58. doi:10.1016/j.radonc.2008.02.002[pubmed]
[18].Greco C, Rosenzweig K, Cascini GL, et al. Current status of PET/CT for tumour volume definition in radiotherapy treatment planning for non-small cell lung cancer (NSCLC). Lung Cancer 2007; 57 (2):125-134. doi:10.1016/j.lungcan.2007.03.020[pubmed]
[19].Weiss E, Hess CF. The impact of gross tumor volume (GTV) and clinical target volume (CTV) definition on the total accuracy in radiotherapy theoretical aspects and practical experiences. Strahlenther Onkol 2003;179 (1):21-30. doi:10.1007/s00066-003-0976-5[pubmed]