Original Article

Reliability and Validity of the Questionnaire on Annual Physical Activity Pattern: A
Validation Study using Combined Heart Rate and Accelerometry Data as an Objective
Measurement
1Boris ABrühmann, 1Martina E Schmidt, 3Angelika Wientzek, 3Matthäus Vigl, 2,4Birgit Teucher, 2Verena A Katzke, 3Heiner Boeing, 3Manuela M Bergmann, 2Rudolf Kaaks, 1Karen Steindorf
- 1 Unit of Physical Activity and Cancer, Division of Preventive Oncology, German Cancer Research Center (DKFZ) and National Center for Tumor Diseases (NCT), Im Neuenheimer Feld 280, 69120 Heidelberg, Germany.
- 2 Divisions of Cancer Epidemiology (C020), German Cancer Research Center (DKFZ), ImNeuenheimer Feld 280, 69120 Heidelberg, Germany.
- 3 Department of Epidemiology, German Institute of Human Nutrition Potsdam-Rehbruecke, Arthur-Scheunert-Allee 114-116, 14558 Nuthetal, Germany.
- 4 Department of Translational Pulmonology, University of Heidelberg, ImNeuenheimer Feld 350, 69120 Heidelberg, Germany
- Submitted Tuesday, October 21, 2014
- Accepted:Sunday, December 07, 2014
- Published Wednesday, December 31, 2014
This is an Open Access article distributed under the terms of the Creative Commons Attribution License (http://creativecommons.org/licenses/by/3.0), which permits unrestricted use, distribution, and reproduction in any medium, provided the original work is properly cited
Abstract
Introduction
Physical activity (PA) is a modifiable lifestyle factor with great public health potential. However, it is still unclear which type, intensity, and temporal pattern of PA is most beneficial. Therefore, a Questionnaire on Annual Physical Activity Pattern (QUAP) for healthy adults was developed; focusing on a detailed assessment of past year PA.The aim was to investigate its test-retest reliability and validity.
Materials and Methods
The self-administered 22-item questionnaire was evaluated in a study embedded into the European Prospective Investigation into Cancer and Nutrition (EPIC) project. Participants included men and women aged 47-82. Reliability was examined in 119 participants by comparing two measurements taken 6-8 weeks apart. Criterion validity was examined in 1109 participants by comparing the physical activity level (PAL) derived from an accelerometry device (Actiheart) to those from the questionnaire.
Results
Reliability was acceptable overall with intraclass correlation coefficients ranging from 0.64 to 0.87, with the exception of the domain sedentary behaviour (r=0.43).Regarding validity, the Spearman correlation coefficient was 0.33. Slightly higher correlations were found for men (rs=0.34), and participants with a lower BMI (rs=0.36). Bland-Altman plots showed a mean difference of -0.00 (SD=0.22) for total PA.
Conclusions
Our findings suggest that the questionnaire has acceptable reliability and validity comparable to other questionnaires. It enables the identification of domain-specific activity patterns and a differentiation between participants with similar energy expenditure but different behaviour. This additional information about distinct activity patterns may finally enable researchers to analyse PA more specifically in terms of health benefits and to provide more detailed public health recommendations
Keywords
Questionnaire, accelerometer, epidemiology, reliability, validity, physical activity
Introduction
Physical activity (PA) is a modifiable lifestyle factor with great public health potential regarding risk reduction for several chronic diseases [1 6]. Various guidelines for healthy populations as well as for patients with special diseases or for cancer survivors exist, all recommending to be regularly active and to avoid inactivity. Guidelines for adults (18-64 years old)usually promote about 30 to 60 minutes of moderate to vigorous intensity PA per day on 5 or more days per week.In addition, they recommend participating in muscle-strengthening activities involving major muscle groups on 2 or more days per week [7 9 6]. However, it is still unclear which type, intensity, and temporal pattern of PA is most beneficial to health [10 7 11]. The effect of irregular or acute periods of exhaustive activity may differ from the effect of being constantly active or having an overall active lifestyle. Due to the design of existing questionnaires and the type of information collected, there are still relevant gaps in evidence that hinder formulating more specific public health recommendations.
Due to the advancement in technology, more and more studies use movement sensors such as accelerometers to assess PA [12 13 14 14
15 16 17 18
19 20]. This development adds new information to PA and health research. However, such devices also have their limitations. They are, inter alia, not able to truly detect contextual information, which includes insight about the type of activity, such as soccer or gymnastics, as well as information about the domain(e.g. occupation, household, leisure time)within which participants engage in a given behaviour [21]. Most of the devices are still not able to assess certain basic or everyday behaviour, such as walking on an incline, carrying loads, resistance exercise, cycling, upper body movement [22 27 12 13], or swimming [16], which can result in an underestimation of energy expenditure (EE). Thus, applying a combination of both movement sensors and innovative PA questionnaires as complimentary tools is currently considered the most promising approach to assessing PA in epidemiological studies [28 29].
Questionnaire on Annual Physical Activity Pattern (QUAP) for healthy adults. The focus of this new questionnaire is to assess past year PA in all relevant domains and to estimate EE. The questionnaire was recently implemented, complementary to an accelerometry device, in the pretesting of the German National Cohort study, a large-scale, nationwide, prospective follow-up study in Germany that started recruitment in 2014.The aim of this manuscript is to report on the test-retest reliability and validity studies conducted in the German component of the European Prospective Investigation into Cancer and Nutrition (EPIC). For the latter, physical activity level (PAL) values generated by a heart rate and accelerometer device were compared to those of the QUAP.
Materials and Methods
Questionnaire on Annual Physical Activity Pattern
The self-administered questionnaire consists of 22 items on PA performed over the previous 12 months and is divided into 6 sections to assess the domains occupation, household, locomotion, leisure time PA, sports and exercise, and sedentary behaviour. It covers information about the type of activities as well as the frequency (months/year, days/week or month), duration (hours/day), and perceived intensity of the activity. Levels of intensity are assessed as light, moderate, some what heavy, and predominantly heavy. A list of types of sports is given at the beginning of the section “sports and exercise” as a prompt for participants. As the reference period is a full year, seasonal variations are also considered. The aim is to enable the identification of domain-specific longer-term activity patterns and to differentiate between participants with similar EE but different activity patterns. The latter allows us to differentiate between participants who accumulate the same amount of energy being active but in different domains or trough different intensities or frequencies.
Study design and population
The self-administered questionnaire was evaluated in a study embedded into the German component of EPIC.From the original EPIC-cohort in Germany of about 53,000 participants, who were recruited at baseline from 1994 to 1998 [30-32], 1615 participated in the sub-study on extensive phenotyping and were asked to fill out the QUAP. The 1547 participants, who returned the questionnaire, were between 47 and 82 years of age and from the general population of the German cities Potsdam and Heidelberg and their surrounding communities. Ethical approval was obtained from the local ethics boards in Heidelberg and Potsdam prior to recruitment, and informed consent was obtained from all participants.Recruitment took place at the study centres in Heidelberg and Potsdam, where the participants completed the PA questionnaire and were equipped with a combined heart rate and movement sensor. For calibration of the individual heart rate workload relation, a step test was performed.Exclusion criteria for the long term objective PA measurement were plaster allergy and physical impairment.Additional exclusion criteria for the step test were severe cardiologic illness, current use of beta blockers (more than half of the maximum dose/day), or a disability that prevented the participant from walking unaided. In case a smaller dose of beta blockers was used by the participant, a shorter version of the step test was performed. For participants, who were excluded from the step test or <4 min of step test data were available, age and sex dependent group calibration parameters were applied [33].
Given the results of the validity test and feedback from the study participants, the original questionnaire has been slightly revised. Minor changes in wording were made to clarify the intent of some questions, and a few questions had to be removed due to time restrictions.Results reported from the reliability study refer to the revised version.
Between 2010 and 2013, the questionnaire was completed by a total of 1547 participants (Figure 1).The sub-group for our reliability study consisted of n=141 participants.Questionnaires were mailed to participants twice between March 2012 and February 2013, with an interval of 6-8 weeks between mailings. After the interval, n=119 participants filled out the questionnaire a second time. The completion rate was 84%.
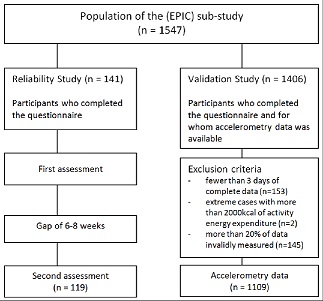
Figure 1:Study design for the Questionnaire on Annual Physical Activity Pattern (QUAP) reliability and validation study
For the validation study a different group of n=1406 participants were recruited. Participants were excluded when they had fewer than three days of complete Actiheart data (n=153), extreme values of physical activity energy expenditure (PAEE), defined as more than 2000 kcal (n=2), or more than 20% of invalid data due to signal noise or missing values (n=145). After applying these exclusion criteria, data from n=1109 participants were available for analysis.
Heart rate and accelerometer measurement
Objective PA data used for our validity analyses came from a combined accelerometer and heart rate monitoring device (Actiheart, Cambridge Neurotechnology LtD, Papworth, UK). The device was attached to the chest via two standard ECG electrodes and measured the participants’ heart rate, its variability, and the ECG amplitude. Acceleration was measured by a piezoelectric element with a dynamic range of 1-7 Hz (3dB) and a sampling frequency of 32 Hz [34]. It showed promising results as a valid tool for the estimation of PAEE over a wide range of activities, including walking and running [36 34]. A step test was performed to individually calibrate the relationship between heart rate and physical work load. After calibration, participants were instructed to wear the device for 7 consecutive days. Data from at least six full days was available for 95% of the participants. The PAL value for each individual participant was produced from the processed raw acceleration signals by the Actiheart software. Only complete days were used for analyses. A more detailed description of the assessment methods can be found elsewhere [33].
Statistical analyses
The PA outcome measurements used to investigate the reliability and criterion validity of the questionnaire included the number of hours per week spent in each domain (e.g. household, locomotion, or leisure time PA) and the total amount of PA (i.e. the sum of all domains) during the past year. The hours spent per week in each domain were multiplied by the estimated metabolic cost of each activity (metabolic equivalent (MET) value) as determined by the Compendium of Physical Activities [37]. MET values are defined as the ratio of the work metabolic rate to a standard resting metabolic rate of 3.5 ml*kg-1*min-1 of oxygen uptake. For this reason, one MET is considered to be the energy cost of a person at rest [38 41]. The total activity, expressed as MET-hours/week, was then converted to a PAL value. It was adjusted to reflect 24 hours by adding missing hours or by subtracting over-reported hours multiplied by 1.3 MET as reported in other studies [39 41]. This MET factor was chosen under the assumption that most of the unreported time was spent with sedentary activities.
Since some of the data distributions were non-normal, non-parametric tests such as the Spearman rank correlation were used to assess reliability and validity. The test-retest reliability of the questionnaire was examined by comparing MET-hours/week of the individual domains and total activity for both of the measurements (6-8 weeks apart). We calculated intraclass correlation coefficients (ICC) and their 95% confidence intervals (CI), using the ICC type ‘2,1’based on a two-way model of PA scores in participants questioned at two independent, random times. The model considered the time effect on the variability of scores[42]
Criterion validity was examined by comparing the PAL values derived from the questionnaire to those from the objective measurement. The median and interquartile ranges (IQR) of the individual differences between both measurements and the Spearman rank correlations with 95% CIs for the whole group, as well as for subgroups defined by sex, age, and BMI, were calculated. In addition, the agreement between methods was analysed using the Bland-Altman method [43 44]by plotting the individual PAL differences against the average of the measurements. This enabled the identification of systematic and random errors, outliers, trends, and the extent of agreement. Analyses also included the agreement in individuals, defined as 95% limit of agreement. Limits were defined as mean±1.96 standard deviation (SD) of the differences[39]. Assumptions for this method, i.e. homoscedasticity and normality, were checked.
Questionnaires were scanned and verified with Cardiff Teleform V10.7 (available from Digital Documents, Cherry Valley, California) before being transferred into the Statistical Analysis Software (SAS) 9.3 (SAS Institute, Inc., Cary, North Carolina) for analysis.
Results
The 119 participants of the reliability study included more females (n=74) than males (n=45) (Table 1).The total average age was 69.8 years (range 52-80) and did not differ by sex. The group was slightly to moderately overweight with a mean BMI of 26.65 kg/m2. A total of 1109 participants took part in the validation study. The population was fairly evenly divided between males (n=560) and females (n=549).Total average age was 64.7 years (range 47-82), which was nearly the same for both sexes. The group was slightly to moderately overweight with a mean BMI of 26.92 kg/m2.
|
|
Study population of the reliability study
|
Study population of the validation study
|
|
|
Number
|
%
|
Number
|
%
|
|
Total
|
119
|
100
|
1109
|
100
|
|
Sex
Male
Female
|
45
74
|
37.82
62.18
|
560
549
|
50.50
49.50
|
|
Age (years)
<55
55-64
65-74
≥75
|
3
23
67
26
|
2.52
19.33
56.30
21.85
|
149
419
423
118
|
13.44
37.78
38.14
10.64
|
|
BMI category (kg/m2)
Normal weight (BMI < 25)
Overweight (25 ≤ BMI < 30)
Obese (BMI ≥ 30)
|
34
57
28
|
28.57
47.90
23.53
|
350
498
261
|
31.56
44.91
23.53
|
Comparing the first and second assessments of the questionnaire for the overall study population in our reliability study, the mean values of the second measurements were slightly lower than the first within all domains, with the exception of sports and exercise (Table 2) . The median difference was around zero for each individual domain. For total PA, there was a non-statistically significant median difference (IQR) of 2.17 (37.81) MET-hours/week.
|
Physical activity domains
|
MET-hours/week
|
|
Mean (SD*)
|
Mean difference (SD)
|
Median (IQR*)
|
Median difference (IQR)
|
|
Total PA*
1st assessment
2nd assessment
|
170.49 (60.45)
175.33 (73.85)
|
0.34 (46.17)
|
163.10 (70.43)
162.00 (79.63)
|
2.17 (37.81)
|
|
Household
1stassessment
2ndassessment
|
41.29 (29.24)
41.30 (27.86)
|
1.08 (14.55)
|
36.90 (41.00)
36.00 (36.20)
|
0.08 (16.60)
|
|
Locomotion
1stassessment
2ndassessment
|
19.72 (18.97)
20.45 (22.25)
|
0.14 (14.25)
|
14.63 (21.91)
12.47 (19.56)
|
0.00 (10.38)
|
|
Leisure time walking
1stassessment
2ndassessment
|
6.96 (7.93)
6.38 (6.71)
|
0.82 (5.99)
|
3.75 (8.81)
4.50 (7.59)
|
0.00 (4.03)
|
|
Leisure time cycling
1stassessment
2ndassessment
|
2.90 (4.90)
2.80 (5.08)
|
0.27 (4.38)
|
0.19 (3.75)
0.00 (3.38)
|
0.00 (0.47)
|
|
Sports and exercise
1stassessment
2ndassessment
|
13.41 (18.96)
14.96 (32.39)
|
-1.77 (20.60)
|
7.14 (20.00)
6.00 (19.50)
|
0.00 (8.11)
|
|
Sedentary behaviour
1stassessment
2ndassessment
|
63.61 (26.19)
62.27 (26.03)
|
0.61 (28.06)
|
61.10 (42.25)
61.10 (35.10)
|
0.00 (28.60)
|
* IQR, interquartile range; MET, metabolic equivalent; PA, physical activity; SD, standard deviation.
Intraclass correlations ranged from 0.43 to 0.87 (Table 3). The strongest correlations (>0.70) for the total population were observed in the domains household (r=0.87), total PA (r=0.79), and locomotion (r=0.77). Sports and exercise showed a strong correlation (r=0.70), with a slightly broader CI. Leisure time walking and cycling had moderate correlations, and the test-retest correlation of sedentary behaviour was moderate/weak. None of the domains showed weak correlations (<0.29).
|
Physical activity assessment comparison
|
MET-hours/week
|
|
|
Intraclass correlation coefficient
|
95% confidence
interval
| |
|
|
Total
Male
Female
|
Total
Male
Female
| |
|
Total physical activity
|
0.79
0.71
0.86
|
0.68, 0.85
0.48, 0.84
0.76, 0.92
| |
| |
|
Household
|
0.87
0.78
0.89
|
0.82, 0.91
0.63, 0.88
0.83, 0.93
|
|
|
Locomotion
|
0.77
0.86
0.66
|
0.69, 0.84
0.74, 0.92
0.50, 0.77
|
|
|
Leisure time walking
|
0.65
0.46
0.70
|
0.53, 0.74
0.21, 0.67
0.56, 0.80
|
|
|
Leisure time cycling
|
0.64
0.47
0.75
|
0.52, 0.73
0.20, 0.67
0.63, 0.84
|
|
|
Sports and exercise
|
0.70
0.72
0.60
|
0.59, 0.79
0.54, 0.84
0.41, 0.73
|
|
|
Sedentary behaviour
|
0.43
0.42
0.43
|
0.25, 0.58
0.11, 0.65
0.19, 0.61
|
|
* MET, metabolic equivalent.
Regarding gender-specific correlation coefficients, ICCs for total PA were higher for females (r=0.86) than for males (r=0.71). Females also had higher correlations than males in the following domains: household, walking, and cycling. Males had higher correlations than females in the domains locomotion and sports and exercise. For the domain sedentary behaviour, similar correlations were observed in both genders.
In our validation study, the median PAL difference between questionnaire and accelerometer for the total population was 0.005(Table 4).. The Spearman correlation coefficient for this comparison was rs=0.33. Slightly higher correlations were found for men (rs=0.34) and participants with a lower BMI (rs=0.36). A lower correlation was found in the group of people over age 65 (rs=0.26).
|
Questionnaire compared to heart rate and acceleration device
|
Physical Activity Level (PAL)
|
|
Median PAL difference
(Quest – Actiheart; IQR**)
|
Spearman rank correlation coefficient
|
95% confidence interval
|
|
Total population
|
0.005(0.235)
|
0.33*
|
0.27, 0.38
|
|
Sex
Male
Female
|
-0.011 (0.250)
0.011(0.230)
|
0.34*
0.31*
|
0.26, 0.42
0.23, 0.39
|
|
Age (years)
< 65
≥ 65
|
-0.009 (0.237)
0.026 (0.238)
|
0.29*
0.26*
|
0.21, 0.37
0.17, 0.35
|
|
BMI (kg/m2)
Normal weight
(BMI <
25)
Overweight
(BMI ≥
25)
|
-0.009 (0.212)
0.012 (0.256)
|
0.36*
0.31*
|
0.26, 0.46
0.23, 0.38
|
* p <0.0001; **IQR, interquartile range; PA, physical activity.
Bland-Altman plots show edno mean bias between both measurements with a mean difference of -0.00 (SD=0.22) for total PA as well as a mean difference of -0.01 (SD=0.23) for males and 0.01 (SD=0.22) for females (Figure 2). However, there was slight heteroscedasticity with increasing difference between the accelerometer and questionnaire measures for higher PA levels. The same pattern was seen for both sexes (Figure 3a and b).
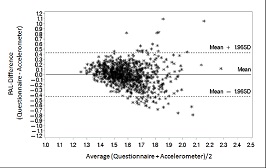
Figure 2: Bland-Altman plot of difference in PAL estimates against the mean of the two measurements:Mean (SD) of the differences: -0.00 (0.22), 95% limits of agreement: -0.43 to 0.43, Mean (SD) of the averages: 1.60 (0.15)
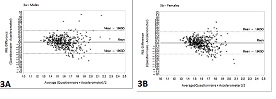
Figure 3a/b: Bland-Altman plot of difference in PAL estimates against the mean of the two measurements, separated by gender: a) Mean (SD) of the differences: -0.01 (0.23), 95% limits of agreement: -0.46 to 0.44, Mean (SD) of the averages: 1.60 (0.15); b) Mean (SD) of the differences: 0.01 (0.22), 95% limits of agreement: -0.42 to 0.44, Mean (SD) of the averages: 1.59 (0.15)
While males had more extreme values, values for females showed a better and denser cloud around the mean difference line. The mean average of the PAL values from both instruments was 1.6 in both genders (Figure 3a/b).The plots suggested better agreement between the PAL value of the questionnaire and the Acti heart for less active participants, but larger, yet not systematic, deviations for highly active participants.
Discussion
In this study, test-retest reliability and criterion validity of a self-administered questionnaire assessing past year PA patterns among men and women aged 47-82 years were investigated. Overall, reliability was acceptable, with the exception of the domain sedentary behaviour. Reliability tended to be higher in the domains household, locomotion, and total PA for the entire study population. The correlation of the questionnaire with the heart rate monitoring and accelerometry device regarding PAL was modest. Slightly higher correlations could be seen for males and for participants with a lower BMI. Bland-Altman plots suggested moderate agreement between the PAL value of the questionnaire and the PAL value of the accelerometry device without a mean bias. Slight heteroscedasticity indicated better agreement for participants with low PA than for highly active participants.
The observed levels of reliability and validity for the past year PA questionnaire were comparable too their instruments assessing habitual or global PA [45 50]. An extensive review by Helmerhorst et al. [51] about existing and more recently developed PA questionnaires with varying time frames showed that most of the reliability correlation coefficients in our study were in the same range (0.62-0.76). Our reliability results regarding total PA and the domains household and locomotion were even better, with r=0.79, 0.87, and 0.77, respectively. The domain sedentary behaviour, in contrast, showed a lower reliability with r=0.43.Regarding validity, QUAP, with a correlation of rs=0.33, is in the centre of the range (0.25-0.41) observed in the review. It must be taken into consideration, however, that these reference values include a broad range of PA questionnaires with all kinds of time frames. Additionally, the relatively weak correlation may reflect measurement errors in the accelerometry device as much as in the questionnaire.
A general limitation of this study is that estimating total EE objectively over 7 days is not a true “gold standard” to use as comparison method to assess the validity of the QUAP. Both methods have their limitations, which leads to a lesser degree of agreement between the two. The currently most accurate method of measuring total EE is doubly labeled water (DLW). However, due to its high costs and feasibility aspects, it was not suitable for our large-scale study. Thus, assessing the agreement of the questionnaire with objectively measured data is the most feasible approach to provide valuable insides into the validity of the instrument. The device was worn for only a 1-week period, which is not representative of the total 12 months assessed by our questionnaire. Additionally, the accelerometry device focusses on the assessment of counts and their transformation into energy, whereas our questionnaire focusses on PA in different domains and the resulting EE. The two instruments are, however, comparable due to the fact that our questionnaire is able to compute a PAL value similar to the PAL value produced by the device. Regarding the age of our study population, we have a relatively old group, with an average age of 65 years. This is caused by the utilisation of our questionnaire within the EPIC project, which started recruitment at baseline between 1994 and 1998. Results show that younger participants (<65 years of age) tend to have a lower median PAL difference, suggesting better agreement, than their older counterparts. It is known that the assessment of PA in older adults is a challenge, partly due to the fact that they are more likely to engage in light to moderate intensity PA, which is the most difficult type of activity to assess [52].
Strengths of our study are the relatively large and well-distributed sample of men and women and the wide age range. The study population was recruited in the EPIC study centres, which ensured a standardised and high-quality assessment. Both recruitment and measurements were performed by trained staff and according to standardised protocols. The main method for the criterion validity, the Acti heart device, provided us with heart rate and activity data over several 24h days. Compared to devices using accelerometry only, the Acti heart uses a combination of heart rate and accelerometry and calculates PA related variables within a branched equation model using parameters individually set for each participant through step test calibration and sleeping heart rate recordings. This results in an improved precision in the estimation of PAEE and PAL [53]. The device is waterproof, which enabled continuous wear, and is considered to be an acceptable method of validating questionnaires. A number of studies that tested heart rate monitors including accelerometry against indirect calorimetry and the doubly labeled water method found good results for the assessment of walking, running, and PAEE [35 34 54].
Comparing different types of assessment methods, such as subjective versus objective methods, is additionally advantageous in that both are supposed to have an individual error structure that is conceptually independent from the other. Therefore, the correlations between the objective measurements and the questionnaire tend to be underestimated [55 45]. This does not apply to validity studies comparing two PA questionnaires, as questionnaires tend to have a similar error structure.
Our reliability analyses confirmed the frequent finding that sedentary behaviour is difficult to assess with questionnaires. This is a common problem[56 58], as questionnaires are more reliable and valid for activities of moderate-to-vigorous intensity [12]. Assessing PA correctly is a difficult task, as it is multidimensional and complex. Given the derivative characteristics of the different assessment methods, there is no single method suitable for capturing all dimensions and domains of PA and thus covering all its aspects. Questionnaires can provide details and context of behaviour patterns, and they are good at assessing the type of activity and differentiating between domains. Electronic devices, on the other hand, are good at quantifying the amount and intensity of PA and the amount of sedentary behaviour. Large-scale studies should therefore implement both assessment methods. This will enable researchers to use the most appropriate data for their research question.
Conclusions
Our questionnaire aims to assess PA in all relevant domains, to identify domain-specific activity patterns, and to differentiate between participants with similar EE but different activity patterns. More information about distinct activity patterns may finally enable researchers to analyse PA more specifically in terms of health benefits and to provide more detailed public health recommendations. This study has shown that the QUAP questionnaire has acceptable reliability and criterion validity for the measurement of past year PA in a population of healthy men and women. Thus, it appears to be a feasible tool to assess PA in epidemiological studies such as the National Cohort in Germany.
Learning Points
Improved assessment of distinct physical activity patterns may enable more detailed public health recommendations.
The newly developed questionnaire has acceptable reliability and criterion validity for the measurement of past year PA.
The questionnaire appears to be a feasible tool for epidemiological studies to assess PA in all relevant domains.
Abbreviations
EPIC: European Prospective Investigation into Cancer and Nutrition; PAEE: physical activity energy expenditure; CI: confidence interval; EE: energy expenditure; ICC: intraclass correlation coefficient; IQR: interquartile range; MET: metabolic equivalent; PA: physical activity; PAL: physical activity level; QUAP: questionnaire on annual physical activity pattern; SD: standard deviation.
Authors’ contributions
BB performed the literature research, collected and analysed the data, scanned and verified questionnaires, and drafted the manuscript. KS, MS and BB developed the questionnaire, contributed to the design of the study, and have been involved in interpreting the data and drafting and revising the manuscript. AW, MV, BT, VK, MB, HB and RK were involved in data collection and data cleaning for the accelerometry and questionnaire data. All authors critically read and gave final approval of the version to be published.
Conflict of interest
The author(s) declare that they have no competing interests
Acknowledgements
Dr. Yesilda Balavarca helped with statistical guidance regarding the ICC. Ann Thüringer supported the preparation of this manuscript.A copy of the Questionnaire on Annual Physical Activity Pattern can be obtained from Prof. Dr. Karen Steindorf, Division of Preventive Oncology, German Cancer Research Center (DKFZ) and National Center for Tumor Diseases (NCT), Im Neuenheimer Feld 280, 69120 Heidelberg, Germany (e-mail: k.steindorf@dkfz-heidelberg.de).
Reference List
[1].Friedenreich CM. Physical activity and cancer prevention: from observational to intervention research. Cancer epidemiology, biomarkers & prevention : a publication of the American Association for Cancer Research, cosponsored by the American Society of Preventive Oncology. 2001;10(4):287-301.
[2]Friedenreich CM, Courneya KS, Bryant HE. Influence of physical activity in different age and life periods on the risk of breast cancer. Epidemiology. 2001;12(6):604-12. [Pubmed]
[3].. Cust AE, Armstrong BK, Friedenreich CM, Slimani N, Bauman A. Physical activity and endometrial cancer risk: a review of the current evidence, biologic mechanisms and the quality of physical activity assessment methods. Cancer causes & control : CCC. 2007;18(3):243-58. doi:10.1007/s10552-006-0094-7.
[4]. Monninkhof EM, Elias SG, Vlems FA, van der Tweel I, Schuit AJ, Voskuil DW et al. Physical activity and breast cancer: a systematic review. Epidemiology. 2007;18(1):137-57. doi:10.1097/01.ede.0000251167.75581.98.
[5].Increasing physical activity of high intensity to reduce the prevalence of chronic diseases and improve public health. The open cardiovascular medicine journal. 2013;7:1-8. doi:10.2174/1874192401307010001.[pubmed]
[6]Warburton DE, Charlesworth S, Ivey A, Nettlefold L, Bredin SS. A systematic review of the evidence for Canada's Physical Activity Guidelines for Adults. The international journal of behavioral nutrition and physical activity. 2010;7:39. doi:10.1186/1479-5868-7-39 [pubmed]
[7].Physical Activity Guidelines Advisory Committee. Physical Activity Guidelines Advisory Committee Report, 2008. Washington, DC: U.S.Department of Health and Human Services, Services USDoHaH;2008.
[8] . Haskell WL, Lee IM, Pate RR, Powell KE, Blair SN, Franklin BA et al. Physical activity and public health: updated recommendation for adults from the American College of Sports Medicine and the American Heart Association. Medicine and science in sports and exercise. 2007;39(8):1423-34. doi:10.1249/mss.0b013e3180616b27.
[9]World Health Organization (WHO). Global Recommendations on Physical Activity For Health[http://www.who.int/dietphysicalactivity/publications/9789241599979/en/index.html] last accessed on September 4, 2013.
[10].Lagerros YT, Lagiou P. Assessment of physical activity and energy expenditure in epidemiological research of chronic diseases. EurJEpidemiol. 2007;22(6):353-62. doi:10.1007/s10654-007-9154-x [doi].[pubmed]
[11].Du M, Kraft P, Eliassen AH, Giovannucci E, Hankinson SE, De Vivo I. Physical activity and risk of endometrial adenocarcinoma in the Nurses' Health Study. International journal of cancer Journal international du cancer. 2014;134(11):2707-16. doi:10.1002/ijc.28599 [pubmed]
[12]Lee IM, Shiroma EJ. Using accelerometers to measure physical activity in large-scale epidemiological studies: issues and challenges. British journal of sports medicine. 2014;48(3):197-201. doi:10.1136/bjsports-2013-093154.
[13].Colley RC, Garriguet D, Janssen I, Craig CL, Clarke J, Tremblay MS. Physical activity of Canadian adults: accelerometer results from the 2007 to 2009 Canadian Health Measures Survey. Health reports. 2011;22(1):7-14.
[14].. Denkinger MD, Franke S, Rapp K, Weinmayr G, Duran-Tauleria E, Nikolaus T et al. Accelerometer-based physical activity in a large observational cohort--study protocol and design of the activity and function of the elderly in Ulm (ActiFE Ulm) study. BMC geriatrics. 2010;10:50. doi:10.1186/1471-2318-10-50.
[15].. Shiroma EJ, Freedson PS, Trost SG, Lee IM. Patterns of accelerometer-assessed sedentary behavior in older women. JAMA : the journal of the American Medical Association. 2013;310(23):2562-3. doi:10.1001/jama.2013.278896 [pubmed]
[16]Hamer M, Kivimaki M, Steptoe A. Longitudinal patterns in physical activity and sedentary behaviour from mid-life to early old age: a substudy of the Whitehall II cohort. Journal of epidemiology and community health. 2012;66(12):1110-5. doi:10.1136/jech-2011-200505 [pubmed]
[17]Stamatakis E, Hamer M, Tilling K, Lawlor DA. Sedentary time in relation to cardio-metabolic risk factors: differential associations for self-report vs accelerometry in working age adults. International journal of epidemiology. 2012;41(5):1328-37. doi:10.1093/ije/dys077.[pubmed]
[18]Whincup P, Morris R, Wannamethee G. British Regional Heart Study Newsletter 2013 [http://www.ucl.ac.uk/pcph/research-groups-themes/brhs-pub/tools/pdfs/Newsletter2013] last accessed on March 27, 2014.
[19]LaMonte M. Objective Physical Activity and Cardiovascular Health in Women Aged 80 and Older (OPACH80) [www.sphhp.buffalo.edu/social-and-preventive-medicine/research-and-facilities/funded-research/cardiovascular-diseases/activity-and-cardiovascular-health-in-postmenopausal-women.html] last accessed on March 28, 2014.
[20]Keyserling TC. Objective Physical Activity and Cardiovascular Health in Women Aged 80 and Older [http://hpdp.unc.edu/research/projects/objective-physical-activity-and-cardiovascular-health-in-women-aged-80-and-older/] last accessed on March 28, 2014.
[21]. Matthews CE, Moore SC, George SM, Sampson J, Bowles HR. Improving self-reports of active and sedentary behaviors in large epidemiologic studies. Exercise and sport sciences reviews. 2012;40(3):118-26. doi:10.1097/JES.0b013e31825b34a0.
[22].Janz KF. Physical activity in epidemiology: moving from questionnaire to objective measurement. BrJSports Med. 2006;40(3):191-2. doi:40/3/191 [pii];10.1136/bjsm.2005.023036 [doi] [pubmed]
[23].Murphy SL. Review of physical activity measurement using accelerometers in older adults: considerations for research design and conduct. PrevMed. 2009;48(2):108-14. doi:S0091-7435(08)00630-0 [pii];10.1016/j.ypmed.2008.12.001 [doi].[pubmed]
[24].Welk GJ, Blair SN, Wood K, Jones S, Thompson RW. A comparative evaluation of three accelerometry-based physical activity monitors. MedSciSports Exerc. 2000;32(Suppl 9):489-97.[pubmed]
[25].Warren JM, Ekelund U, Besson H, Mezzani A, Geladas N, Vanhees L. Assessment of physical activity - a review of methodologies with reference to epidemiological research: a report of the exercise physiology section of the European Association of Cardiovascular Prevention and Rehabilitation. EurJCardiovascPrevRehabil. 2010;17(2):127-39. doi:10.1097/HJR.0b013e32832ed875 [doi].
[26]Matthews CE, Hagstromer M, Pober DM, Bowles HR. Best practices for using physical activity monitors in population-based research. MedSciSports Exerc. 2012;44(Suppl 1):68-76. doi:10.1249/MSS.0b013e3182399e5b[doi];00005768-201201001-00009 [pii] [pubmed]
[27].Van Remoortel H, Raste Y, Louvaris Z, Giavedoni S, Burtin C, Langer D et al. Validity of six activity monitors in chronic obstructive pulmonary disease: a comparison with indirect calorimetry. PLoSOne. 2012;7(6). doi:10.1371/journal.pone.0039198 [doi];PONE-D-11-24879 [pii].
[28].Troiano RP, Pettee Gabriel KK, Welk GJ, Owen N, Sternfeld B. Reported physical activity and sedentary behavior: why do you ask? Journal of physical activity &health. 2012;9 Suppl 1:68-75 [pubmed]
[29]Csizmadi I, Lo Siou G, Friedenreich CM, Owen N, Robson PJ. Hours spent and energy expended in physical activity domains: results from the Tomorrow Project cohort in Alberta, Canada. The international journal of behavioral nutrition and physical activity. 2011;8:110. doi:10.1186/1479-5868-8-110.
[30].Boeing H, Wahrendorf J, Becker N. EPIC-Germany--A source for studies into diet and risk of chronic diseases. European Investigation into Cancer and Nutrition. AnnNutrMetab. 1999;43(4):195-204. doi:12786 [pii][pubmed]
[31].Riboli E, Hunt KJ, Slimani N, Ferrari P, Norat T, Fahey M et al. European Prospective Investigation into Cancer and Nutrition (EPIC): study populations and data collection. Public Health Nutr. 2002;5(6B):1113-24. doi:10.1079/PHN2002394 [doi];S1368980002001350 [pii].[pubmed]
[32]Riboli E, Kaaks R. The EPIC Project: rationale and study design. European Prospective Investigation into Cancer and Nutrition. International journal of epidemiology. 1997;26 Suppl 1:6-14.
[33]Wientzek A, Vigl M, Steindorf K, Bruhmann B, Bergmann MM, Harttig U et al. The Improved Physical Activity Index for Measuring Physical Activity in EPIC Germany. PloS one. 2014;9(3):e92005.doi:10.1371/journal.pone.0092005 [pubmed]
[34]Brage S, Brage N, Franks PW, Ekelund U, Wareham NJ. Reliability and validity of the combined heart rate and movement sensor Actiheart. EurJClinNutr. 2005;59(4):561-70. doi:1602118 [pii];10.1038/sj.ejcn.1602118 [doi].[pubmed]
[35]Crouter SE, Churilla JR, Bassett DR, Jr. Accuracy of the Actiheart for the assessment of energy expenditure in adults. EurJClinNutr. 2008;62(6):704-11. doi:1602766 [pii];10.1038/sj.ejcn.1602766 [doi].
[36].Corder K, Brage S, Wareham NJ, Ekelund U. Comparison of PAEE from combined and separate heart rate and movement models in children. MedSciSports Exerc. 2005;37(10):1761-7. doi:00005768-200510000-00017 [pii].
[37].Ainsworth BE, Haskell WL, Herrmann SD, Meckes N, Bassett DR, Jr., Tudor-Locke C et al. 2011 Compendium of Physical Activities: a second update of codes and MET values. MedSciSports Exerc. 2011;43(8):157581.doi:10.1249/MSS.0b013e31821ece12 [doi]
[38]Howley E. You asked for it Question Authority. ACSM'S Health & Fitness Journal. 2000;4(1):6,40.
[39]. Schmidt ME, Slanger T, Chang-Claude J, Wahrendorf J, Steindorf K. Evaluation of a short retrospective questionnaire for physical activity in women. EurJEpidemiol. 2006;21(8):575-85. doi:10.1007/s10654-006-9042-9 [doi].
[40]Pols MA, Peeters PH, Ocke MC, Bueno-de-Mesquita HB, Slimani N, Kemper HC et al. Relative validity and repeatability of a new questionnaire on physical activity. Preventive medicine. 1997;26(1):37-43doi:10.1006/pmed.1996.9995.[pubmed].
[41]Norman A, Bellocco R, Bergstrom A, Wolk A. Validity and reproducibility of self-reported total physical activity--differences by relative weight. International journal of obesity and related metabolic disorders : journal of the International Association for the Study of Obesity. 2001;25(5):682-8. doi:10.1038/sj.ijo.0801597.
[42]Weir JP. Quantifying test-retest reliability using the intraclass correlation coefficient and the SEM. Journal of strength and conditioning research / National Strength &Conditioning Association. 2005;19(1):231-40. doi:10.1519/15184.1.
[43]Bland JM, Altman DG. Statistical methods for assessing agreement between two methods of clinical measurement. Lancet. 1986;1(8476):307-10.
[44]Bland JM, Altman DG. Measuring agreement in method comparison studies. Statistical methods in medical research. 1999;8(2):135-60 [pubmed]
[45].Friedenreich CM, Courneya KS, Neilson HK, Matthews CE, Willis G, Irwin M et al. Reliability and validity of the Past Year Total Physical Activity Questionnaire. American journal of epidemiology. 2006;163(10):95970.doi:10.1093/aje/kwj112.[pubmed]
[46]Friedenreich CM, Courneya KS, Bryant HE. The lifetime total physical activity questionnaire: development and reliability. Medicine and science in sports and exercise. 1998;30(2):266-74 [pubmed]
[47].. Cust AE, Smith BJ, Chau J, van der Ploeg HP, Friedenreich CM, Armstrong BK et al. Validity and repeatability of the EPIC physical activity questionnaire: a validation study using accelerometers as an objective measure. The international journal of behavioral nutrition and physical activity. 2008;5:33. doi:10.1186/1479-5868-5-33.
[48]Craig CL, Marshall AL, Sjostrom M, Bauman AE, Booth ML, Ainsworth BE et al. International physical activity questionnaire: 12-country reliability and validity. Medicine and science in sports and exercise. 2003;35(8):1381-95.doi:10.1249/01.MSS.0000078924.61453.FB.[pubmed]
[49].Wareham NJ, Jakes RW, Rennie KL, Mitchell J, Hennings S, Day NE. Validity and repeatability of the EPIC-Norfolk Physical Activity Questionnaire. International journal of epidemiology. 2002;31(1):168-74. [pubmed]
[50].Matthews CE, Shu XO, Yang G, Jin F, Ainsworth BE, Liu D et al. Reproducibility and validity of the Shanghai Women's Health Study physical activity questionnaire. American journal of epidemiology. 2003;158(11):1114-22 [pubmed]
[51].Helmerhorst HJ, Brage S, Warren J, Besson H, Ekelund U. A systematic review of reliability and objective criterion-related validity of physical activity questionnaires. IntJBehavNutrPhysAct. 2012;9:103. doi:1479-5868-9-103 [pii];10.1186/1479-5868-9-103 [doi].
[52].Washburn RA, Jette AM, Janney CA. Using Age-Neutral Physical Activity Questionnaires in Research with the Elderly. J Aging Health. 1990;2(3):341-56.
[53].. Brage S, Brage N, Franks PW, Ekelund U, Wong MY, Andersen LB et al. Branched equation modeling of simultaneous accelerometry and heart rate monitoring improves estimate of directly measured physical activity energy expenditure. JApplPhysiol. 2004;96(1):343-51. doi:10.1152/japplphysiol.00703.2003 [doi];00703.2003 [pii].
[54]. Villars C, Bergouignan A, Dugas J, Antoun E, Schoeller DA, Roth H et al. Validity of combining heart rate and uniaxial acceleration to measure free-living physical activity energy expenditure in young men. J Appl Physiol (1985). 2012;113(11):1763-71. doi:10.1152/japplphysiol.01413.2011 [pubmed]
[55]Kipnis V, Carroll RJ, Freedman LS, Li L. Implications of a new dietary measurement error model for estimation of relative risk: application to four calibration studies. American journal of epidemiology. 1999;150(6):642-51.[pubmed]
[56]Strath SJ, Bassett DR, Jr., Swartz AM. Comparison of the college alumnus questionnaire physical activity index with objective monitoring. Annals of epidemiology. 2004;14(6):409-15. doi:10.1016/j.annepidem.2003.07.001.[pubmed]
[57]Bonnefoy M, Normand S, Pachiaudi C, Lacour JR, Laville M, Kostka T. Simultaneous validation of ten physical activity questionnaires in older men: a doubly labeled water study. Journal of the American Geriatrics Society. 2001;49(1):28-35.[pubmed]
[58].Jacobs DR, Jr., Ainsworth BE, Hartman TJ, Leon AS. A simultaneous evaluation of 10 commonly used physical activity questionnaires. Medicine and science in sports and exercise. 1993;25(1):81-91. [pubmd]